Helper function to visualize the assumed limit of detection.
Arguments
- modeldata
A
modeldataobject as returned byLOD_assume().
Value
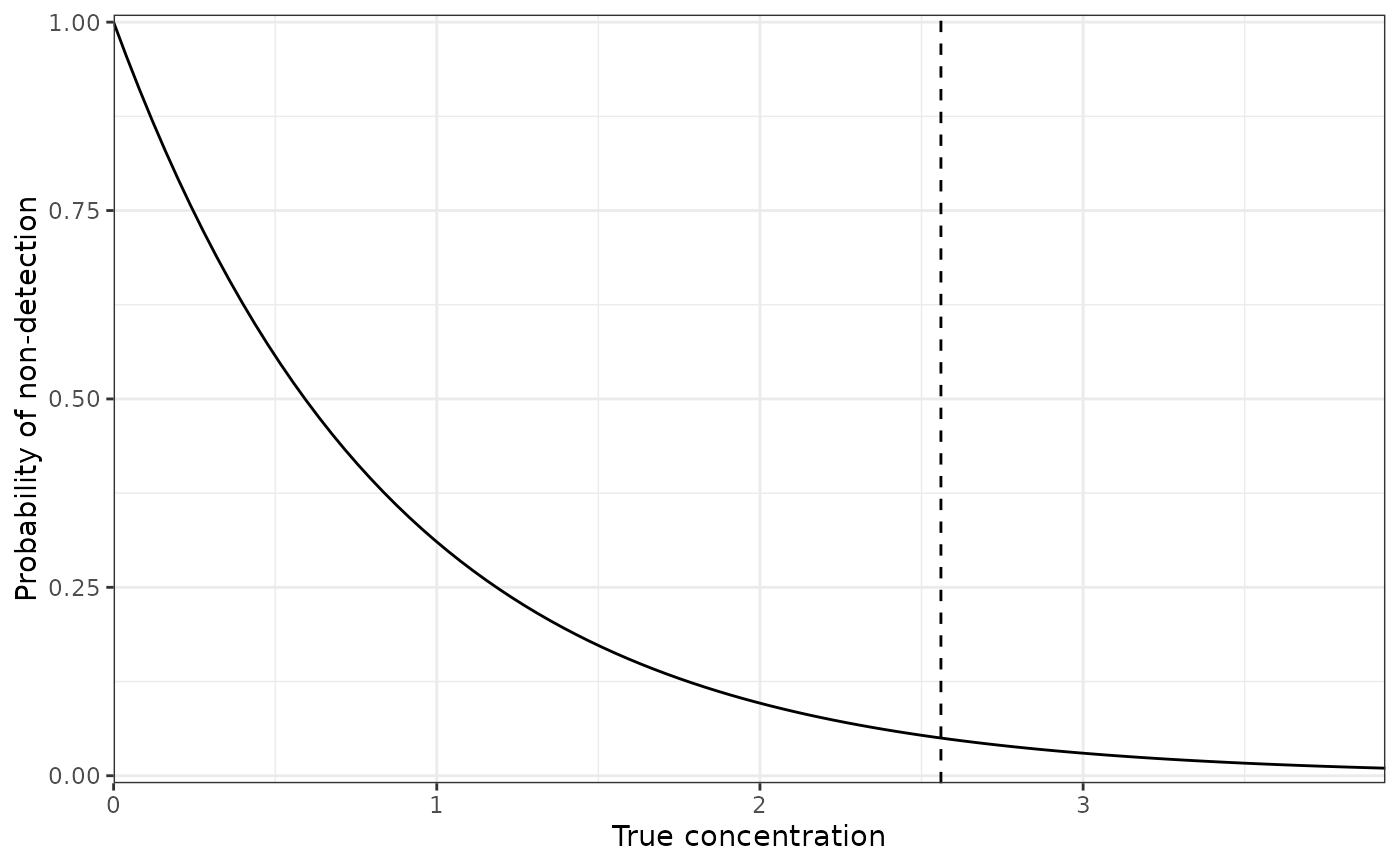
A plot showing the probability of non-detection (i.e. zero
measurement) for different concentrations below and above the assumed LOD.
Can be further manipulated using ggplot2 functions to adjust themes and
scales, and to add further geoms.
Details
This function can also be applied to modeldata objects which have
been passed through several other modeling functions, as long as
LOD_assume() was applied at some point.
Examples
modeldata <- LOD_assume(limit = 2.56, prob = 0.95)
plot_LOD(modeldata)